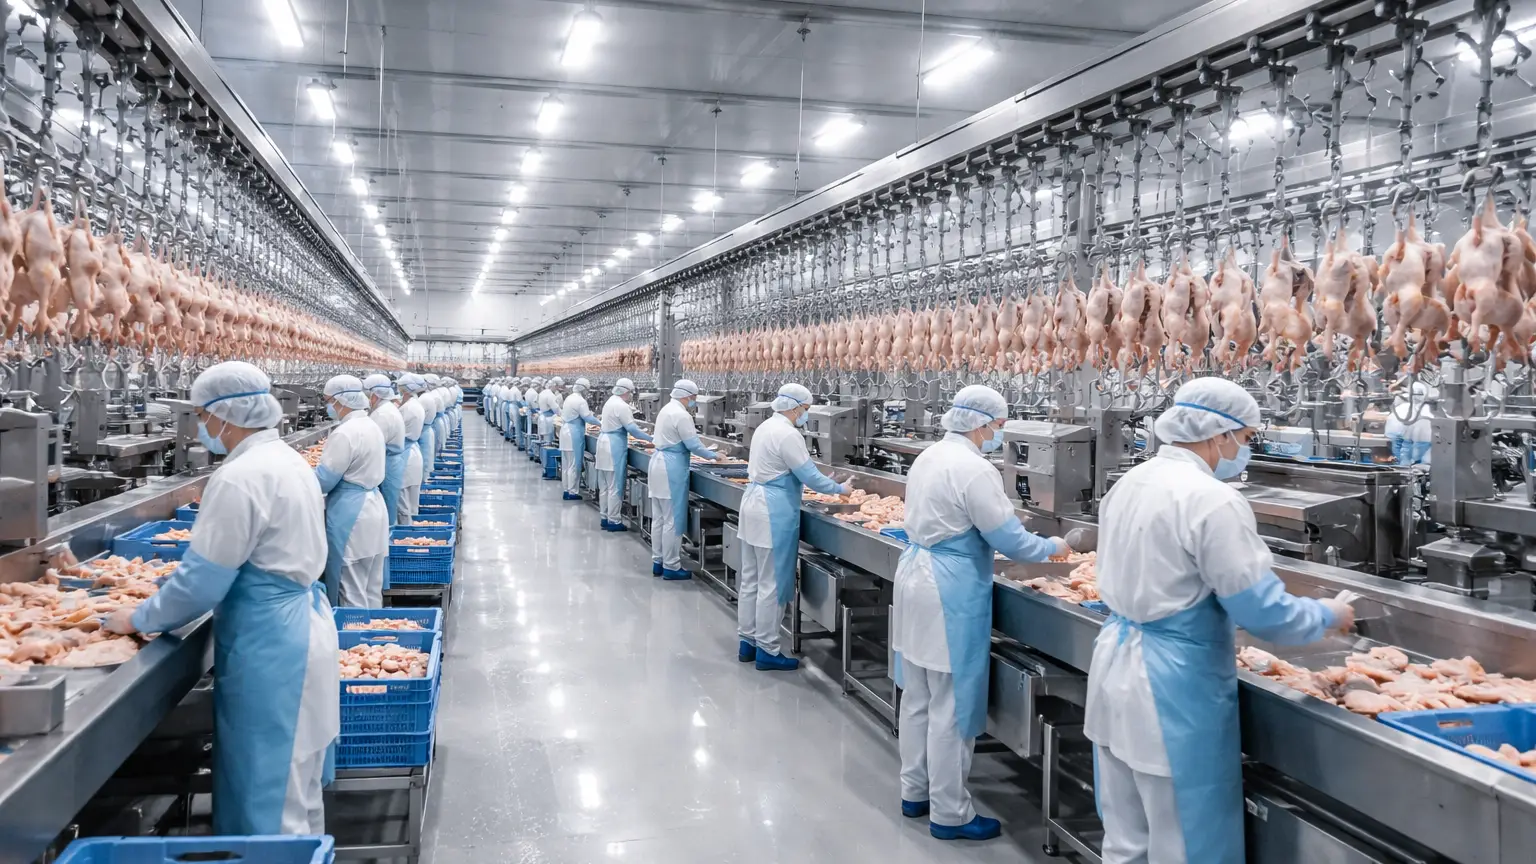
The global poultry processing industry is going through a period of significant change. Rising input costs, stricter biosecurity requirements, and shifting demand for protein ingredients are pushing processors and feed manufacturers to find new ways to get more value out of every part of the production process. One ingredient sitting at the center of this shift is feather meal, a co-product that has moved from being a waste disposal problem to a commercially important revenue stream with a real impact on industry margins.
For procurement managers and business leaders across the animal protein supply chain, tracking the feather meal price index and understanding how it connects to poultry industry economics has become an essential part of managing costs and keeping supply chains stable in 2026.
How Co-Product Economics Are Reshaping Poultry Industry Margins
Poultry processing is a low-margin business. Raw materials account for roughly 61% of total slaughtering costs, leaving very little buffer when markets move. This is why secondary revenue streams like feather meal matter so much. The feather meal price index acts as a live benchmark connecting processing output with the broader feed ingredient market. When prices shift, the effects flow downstream to feed manufacturers, aquaculture operators, and pet food producers, for whom ingredient costs can represent up to two-thirds of total production spending.
Businesses that treat feather meal as a passive by-product rather than an active part of their margin strategy are increasingly falling behind those that do not.
What Feather Meal Is and Why It Matters
Feather meal is a high-protein animal feed ingredient typically containing between 60% and 70% crude protein, with hydrolyzed versions reaching as high as 80% to 90%. Feathers make up between 3% and 7% of a live bird's body weight and are almost entirely made of keratin, a tough structural protein that animals cannot digest in its raw form. Through a process called hydrolysis, which uses high heat and pressure to break down the protein structure, feathers are converted into a digestible, nutrient-rich feed ingredient containing key amino acids like methionine and cysteine. The end product is a versatile ingredient used across livestock feed, aquaculture diets, and premium pet food formulations. Chemtradeasia helps buyers source hydrolyzed feather meal to the quality specifications their operations require.
What Drives the Feather Meal Price Index
Two forces sit at the core of the feather meal price index: how much raw material is available and how much it costs to process it. The hydrolysis process is energy-intensive, which means the index tends to move in line with fuel and energy prices. Product quality also varies depending on the type and age of the bird, with chicken-derived meal generally offering better protein digestibility than turkey-derived alternatives. Compliance with food safety and biosecurity testing standards adds another 15% to 20% to production costs in many markets. Because only a limited number of licensed facilities can legally process feather waste, supply is geographically constrained in ways that can cause sharp price movements when demand picks up.
Why Slaughter Cycles Matter for Supply
Feather meal supply is directly tied to how many birds are being slaughtered at any given time. Each broiler chicken produces feathers equal to roughly 2% to 3% of its live body weight, which translates to about 40 to 60 grams of finished meal after processing. When slaughter activity slows down, whether from labor shortages, plant shutdowns, or disease outbreaks, feather meal supply contracts quickly and there are few short-term alternatives. Avian influenza is the biggest single risk, with regional outbreaks capable of cutting available protein supply by nearly 30%. These supply shocks often cause rapid price spikes, which is why having multiple supply sources and buffer stock in place is increasingly important for buyers.
How Feather Meal Compares to Other Protein Sources
Feather meal offers a strong value proposition when measured against other protein ingredients. In 2023, it was priced at around USD 662 per metric tonne, well below fish meal at USD 1,788 and blood meal at USD 1,159 per metric tonne. Soybean meal remains the most widely used vegetable protein at USD 317 to 345 per short tonne, but it cannot match the amino acid profile or protein concentration of animal-derived ingredients. In aquaculture, nutritionists regularly use hydrolyzed feather meal to replace up to 50% of fish meal in fish and shrimp diets, cutting costs without meaningfully affecting growth performance. Chemtradeasia helps procurement teams keep track of these price spreads to support smarter ingredient buying decisions.
How Export Demand Shapes Regional Prices
Demand from the aquaculture and pet food sectors is one of the key forces shaping feather meal prices across different regions. The pet food market is the fastest-growing end-use segment, driven by rising pet ownership and growing consumer willingness to spend on higher-quality animal nutrition. In Asia-Pacific, aquaculture is the primary demand driver, where hydrolyzed feather meal is used as a more affordable and sustainable alternative to wild-caught fish meal. When these high-growth sectors absorb available regional supply, prices in export-oriented markets tend to firm up quickly. Trade flows into China, where large-scale poultry and swine production depends heavily on imported protein ingredients, add another layer of price sensitivity that buyers need to watch closely.
What This Means for Poultry Processor Margins
For poultry processors, investing in good rendering capability pays off in a straightforward way. One metric tonne of raw feather waste produces approximately 0.5 metric tonnes of finished hydrolyzed meal, turning a disposal cost into a source of commercial income. "Operational excellence should again be a major focus area in 2026, particularly in a context where volatility remains a risk," notes one industry analyst tracking the sector. Co-product revenue from feather meal helps cover the high and often unpredictable costs of live bird procurement and facility operations. In a business where margins are thin and farm-gate prices are rarely transparent, processors who make the most of their rendering operations are in a meaningfully stronger financial position than those who do not.
How Prices Compare Across Key Regions
The feather meal market looks quite different depending on where you are. North America leads global market share with 38.5% of total revenue in 2024, supported by advanced rendering technology and well-integrated processing systems. Europe operates under stricter regulatory and biosecurity requirements, which push production costs higher and support a modest price premium for European-origin material. Asia-Pacific is the fastest-growing market, with China leading both production and consumption growth. Pricing in the region is shaped more by fragmented supply structures and fast-growing urban demand than by processing efficiency, which creates sourcing opportunities for buyers who know where to look. Chemtradeasia provides the regional market knowledge and supplier access to help buyers make the most of these differences.
What to Expect Heading into Late 2026
The feather meal market is expected to grow at a compound annual growth rate of around 8.6%, with the global market projected to reach USD 967 million by 2030. Global poultry meat production is forecast to exceed 130 million metric tonnes by 2026, which should expand the supply of raw feather material over time. However, energy cost uncertainty and the ongoing risk of avian influenza in the Northern Hemisphere mean supply-side volatility is not going away. Buyers who rely on a single origin or react to price changes after the fact are taking on more risk than necessary. Locking in multi-origin contracts, maintaining buffer stock, and keeping a close eye on competing protein price spreads are practical steps that procurement teams can take now to be better prepared. Reach out to Chemtradeasia to discuss how we can support your 2026 feather meal sourcing strategy.
The feather meal price index will stay an important factor in poultry industry margin management throughout 2026 and beyond. Processors who get more value from co-products, feed manufacturers who actively manage protein cost dynamics, and procurement teams who build flexibility into their supply chains will be best placed to handle what remains a complex and fast-moving market. The businesses that treat feather meal as a strategic ingredient rather than a processing footnote will find it an increasingly valuable source of competitive advantage.
Frequently Asked Questions (FAQ)
What is feather meal and how is it made? Feather meal is made by processing poultry feathers through hydrolysis, using high heat and pressure to break down keratin into a digestible feed ingredient containing 60% to 90% crude protein.
Why does the feather meal price index matter for poultry processors? It directly affects co-product revenue. One tonne of feather waste produces roughly 0.5 tonnes of saleable meal, turning a disposal cost into an important margin buffer for processors operating on thin returns.
How does feather meal compare in price to alternatives? At around USD 662 per metric tonne, feather meal is considerably more affordable than fish meal at USD 1,788 and blood meal at USD 1,159, while offering higher protein density than soybean meal.
What causes feather meal prices to spike? Avian influenza outbreaks, energy price increases, and logistics disruptions are the most common triggers, with disease events alone capable of cutting regional supply by nearly 30%.
Which region produces the most feather meal? North America leads with a 38.5% global revenue share as of 2024. Asia-Pacific is the fastest-growing market, with China at the center of regional production and consumption.
Where can I source reliable feather meal supply? Chemtradeasia connects buyers with verified suppliers across Asia-Pacific and beyond. Contact our team to discuss your requirements and sourcing options for 2026.
Leave a Comment